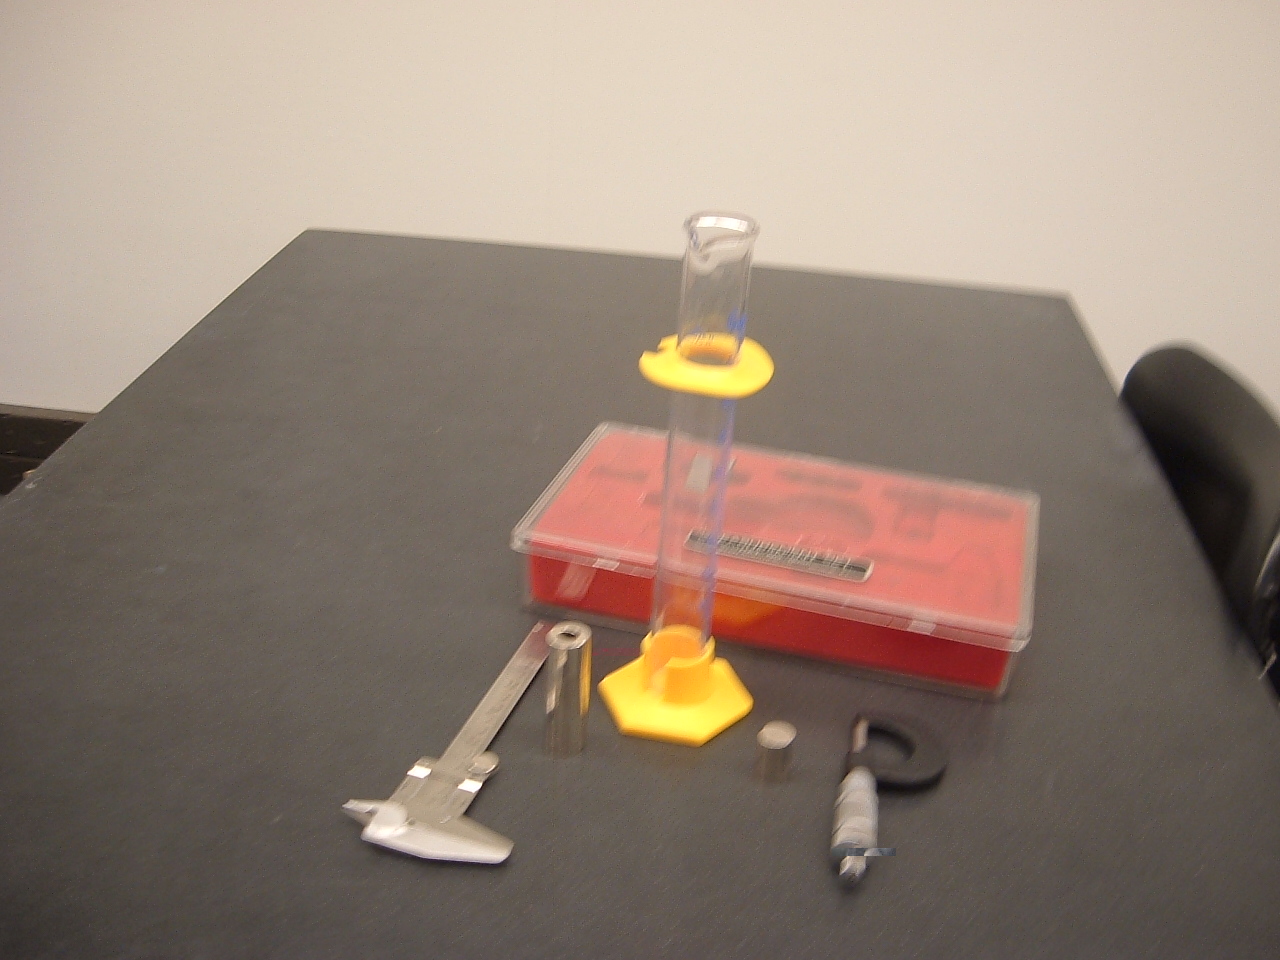
The aim of this experiment is to learn how to use a vernier caliper and a micrometer for the measurement of length. The equipment needed for for this experiment include
Vernier caliper
micrometer
spherical object
cylinderical object
hollow cylinderical object
graduated cylinder
Theory
The Vernier Caliper
The vernier caliper is essentially a ruler with a least count of l mm where a tenth
of a millimeter can be determined more accurately with the help of an attachment that is called a vernier caliper. The vernier scale has 10 divisions which is equal in length to the 9 divisions (9 mm) on the ruler.
10 vernier divisions = 9 mm
1 vernier division = 9 ⁄ 10 mm
That means the difference between one millimeter and one vernier division is
0.1 mm. Therefore the difference between n mm and n vernier divisons is 0.n mm ( 0 < n < 9 ). The first line (mark) of the vernier scale is the mark where measurement is taken. If this mark is located between two millimeter marks in such a way that its n th mark matches a mark on the ruler, then it means the first mark has moved by a length of 0.n millimeter. This is the tenth digit of the measurement in mm or the hundredth digit of the measurement in cm. For example, if the first mark of the vernier is located between the 2.4 cm and the 2.5 cm marks and the 6 th mark of the vernier matches a mark of the ruler, then the reading is 2.46 cm.
The vernier caliper is equipped to measure outside dimensions, inside dimensions and depths.
The Micrometer
The micrometer is essentially a ruler with a least count of 0.5 mm with a screw attached to it. The screw advances a distance of 0.5 mm for each revolution. There are 50 marks on the circular scale. This means:
50 division on the scale = 0.5 mm
1 division on the screw = 1 ⁄ 100 mm
That is the micrometer can read up to ( 1 ⁄ 100 ) th of a millimeter. Note that it takes 2 revolutions for the screw to advance 1 mm. So it is important to note on which revolution (first or second) the measurement is taken. For example, if the screw is between 2 mm and 3 mm marks and the circular division reads 25 and it is in its first revolution, the measurement would be 2 mm + 25 * 0.01 mm = 2.25 mm. While if it is in its second revolution the measurement would be
2 + 0.5 + 25 * 0.01 ) mm = 2.75 mm.
Zero Reading
Instruments are designed to read zero when they are supposed to read zero. But sometimes you might come across instruments that do not read zero when they are supposed to read zero. In such cases zero correction is needed. The zero reading must be subtracted from each reading; i.e,
Measurement = reading of instrument - its zero reading
For example, if a measurement by an instrument of zero reading of 0.1 mm gives a reading of 2.4 mm, the measurement should be taken to the
2.4 - 0.1 mm = 2.3 mm.
Least Count
The least count of an instrument is the smallest unit that can be measured accurately by the instrument. For example, since the smallest unit that can be measured by a vernier caliper is 0.1 mm we say its least count is 0.1 mm. Similarly the smallest unit that can be measured by a micrometer is 0.01 mm and we say its least count is 0.01 mm.
Error of an Instrument
The least count of an instrument gives the smallest accurate digit. But also the tenth of the least count can be approximated. Such approximations are not reliable if the least count is very small. So the error of such measurements should be reported as plus or minus of half of the least count. For example, if a ruler of least count 0.1 cm is used to measure a length of 2.46 cm, it should be reported as ( 2.46 ± 0.05 ) cm.
Statistical Reduction of The Error of An Instrument
The error of an instrument can be reduced statistically by measuring the same thing again and again. This is because it is reasonable to expect that as the number of trials increases the most frequent value and the truth value of the measurement get closer and closer. The measurement is approximated by the average of the statistical data. And the error of the instrument is approximated by the standard deviation of the data; i.e. if the data is x1 , x2 , . . . xn , then the average value ( xav ) is given by
The value of a measurement might be dependent on the angle you look at it. Such kind of an error which is introduced due to the angle of observation is parallax error. Parallax errors can be minimized by looking at an instrument perpendicularly.
Percentage Error
At times you will be required to compare your finding with a known value or a value obtained using a more accurate method. The comparison is made by calculating the percentage error defined as follows:
% error = | ( known or most accurate - experimental value ) ⁄ ( known or most acurate ) | * 100%
And the finding is reported as
experimental value ± % error
Graphing
Put your independent variable (the variable controlled by you) on the horizontal axis and the dependent variable on the vertical line. Most of the time in physics we deal with proportional relationships. The graph of a proportional relationship is a straight line through the origin. Make sure the graph of a proportional relationship passes through the origin. The experimental data of a proportional relationship may not fall on a straight line. In such a case you have to plot the best fitting line.
Procedure
Determining the zero reading of the vernier caliper and the micrometer
Measure the zero reading of the vernier caliper 5 times and take the average.
Measure the zero reading of the micrometer, 5 times and take the average.